Finding DataReaders that are not being close in an .NET application can be something difficult.
Thats why I use this trick to detect which DataReaders where not close.
1. First add a new code file to your project.
2. Enter this code:
public static class SqlReaderTracer
	{
		static Dictionary<WeakReference,System.Diagnostics.StackTrace> traceInfo = new Dictionary<WeakReference,System.Diagnostics.StackTrace>();
		public static System.Data.SqlClient.SqlDataReader ExecuteReaderEx(this System.Data.SqlClient.SqlCommand command)
		{
			var stack = new System.Diagnostics.StackTrace(1, true);
			var reader = command.ExecuteReader();
			traceInfo.Add(new WeakReference(reader), stack);
			return reader;
		}
		public static void PrintTraceState()
		{
			Console.WriteLine("*******SQL Trace Results************");
			foreach (var reader in traceInfo.Keys)
			{
				if (reader.IsAlive)
				{
					var traceInfoFrame =  traceInfo[reader].GetFrame(0);
					var methodWhereItWasCreated =traceInfoFrame.GetMethod().DeclaringType.FullName + "." + traceInfoFrame.GetMethod();
					Console.Write("Reader alive created in " + methodWhereItWasCreated);
					if (traceInfoFrame.GetFileName() != null)
					{
						Console.Write(string.Format("at {0} ({1},{2})",traceInfoFrame.GetFileName(),traceInfoFrame.GetFileLineNumber(),traceInfoFrame.GetFileColumnNumber()));
					}
					Console.WriteLine();

				}
			}
		}

	}
And then to a Find /Replace All and change all the .ExecuteReader() for .ExecuteReaderEx(). 3. Ok Now. You are all set. To test it do something like this:
class Program
	{

		static void Main(string[] args)
		{
			var xxx = new System.Data.SqlClient.SqlConnection(@"Data Source=.\SQLEXPRESS;AttachDbFilename=D:\MyProjects\Phonebook.mdf;Integrated Security=True");
			xxx.Open();
			var ccc = xxx.CreateCommand();
			ccc.CommandText = "SELECT * from Phonebook";
			var reader = ccc.ExecuteReaderEx();
			xxx.Close();
			SqlReaderTracer.PrintTraceState();
			return;
		}
	}
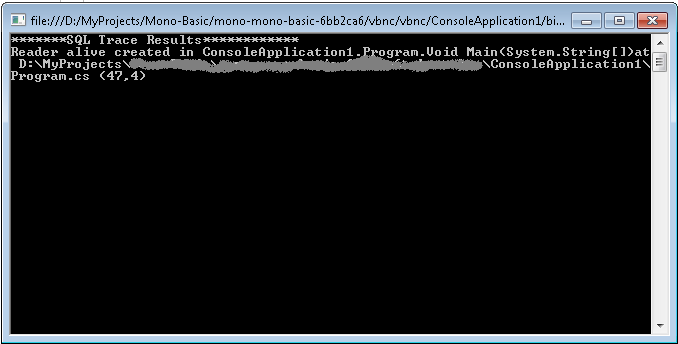
And you will see an output like:
As I use to start stories to my kids when they go to bed:
“A long long time ago when I was a kid there existed a tool called
.NET Reflector, by a great wizard called Lutz Roeder. This wizard created
a magical tool that allowed you to discover what where the dark forces of the
Framework that produced weird behavior. And he provided it to the code warrior so
they could find their path”
Well .NET Reflector still exists and is a great tool, but is no longer free. You can no longer
just download it and enjoy its bliss : S
But is everything loss. Should I sell my sword and horse to be able to use the .NET reflector Oracle jQuery15203662828153464943_1359277348820?
No. There are now good free alternatives.
First one is call ILSpy(http://wiki.sharpdevelop.net/ILSpy.ashx). It looks almost the same as .NET reflector. Is not the same but is very good

And recently JetBrains a clan of powerful code warlocks, has just release another magical jewel,
they called it dotPeek (http://www.jetbrains.com/decompiler/):

Fixing memory leaks is sometimes hard. Because even if you track which is the instance
that is being retained, is difficult to determine WHERE was it created.
Another problem I have found difficult to tackle is when you get an exception because of
code that was put in a finalizer (yes I know that putting code in a Finalizer doesn’t sound like the
best programming practice but sometime I just have to give maintenance to code that does that).
So, my friend Jose de Jesus showed me a nice tip to identify where are those objects being created.
He told me to do the following:
1. Add an instance variable like:
public System.Diagnostics.StackTrace myClassStackTrace = new System.Diagnostics.StackTrace();
2. Just by doing that I can inspect that field and identify where was this particular instance created!.
Cheers
If for any reason you have to debug and develop Silverlight VS 2008,
and you encounter a problem that when you start debugger it reports
something as if the version you have is not supported then first do this:
Open regedit and check:
HKEY_LOCAL_MACHINE\SOFTWARE\Microsoft\Silverlight\Components\Debugging\Value
A Version value of 4.0.50917.0 means that you have the Silverlight 4 Developer and you need to:
1. erase this entry.
2. Uninstall Silverlight 4 Tool
3. Reinstall Silverlight 3 Tools for Visual Studio 2008.
Hi, for several months I lived with an extremely unconfortable bug.
On some pages IE will display an alert dialog indicating
Error
A Runtime Error has occurred.
Do you wish to Debug?
Line: blablabla
Error: blablalba
Well finally I looked in google and found this: http://support.microsoft.com/kb/822521
So if anybody had to live with this bug like me, I hope this helps him
Here is a valuable comment I received. So I'm adding it so it will help somebody else.
I was plagued by the "Runtime error - do you wish to debug?" problem for months
and finally resolved it last night, after testing everything else in the MS knowledgebase
to no avail (http://support.microsoft.com/kb/308260/ln/).
The problem disappeared instantly after a tip-off elsewhere to install & run SpyBot. (Looks like my SpywareBlaster 4.1 failed me there.)
So it wasn't:
my IE 7 settings (Disable script debugging),
operating system (XP Pro SP3),
firewall (Comodo Pro),
antivirus (Avast!) or
scripting engine (WindowsScript 5.7) - just Spyware